Case Study
One Dashboard, Built for Every Role: A Restaurant Franchise Case Study
A multi-location restaurant franchise used to chase its numbers across point-of-sale reports, bank statements, and spreadsheets. We built a web-based command center that pulls sales, labor, and operational data from their POS automatically, then shows it through a dashboard built for whoever is logged in. Brand leadership, individual franchise owners, and on-site managers each see exactly what they need, updated every day, with no manual entry.
Marlon Brand
Founder, Undeniable · Last updated June 2026
Who This Was Built For
The client is Gyro Republic, a multi-location, fast-casual gyro franchise with several locations operating under one brand.
Like most franchise groups, the business has a layered structure. Brand leadership oversees the whole network. Individual franchisees own specific locations. General managers run day-to-day operations at each store.
That structure is exactly what made the project hard. Gyro Republic needed one system that could serve four very different audiences, executive leadership, individual franchise owners, on-site managers, and a platform admin, without any one group having to dig through data meant for someone else.
The Problem Before This Existed
Before this platform, the client's data lived in disconnected places. Point-of-sale reports. Manually exported bank statements. A handful of Google Sheets tracking whatever the POS couldn't capture, loyalty numbers, vendor reports, one-off manual entries. There was no single, role-appropriate view of how the business, or any one location, was actually performing.
No unified view across locations
Leadership had no easy way to compare store performance side-by-side or see brand-wide trends without manually pulling reports per store.
Manual bank statement categorization
Expense tracking from bank statements was a manual, repetitive categorization task, every period, by hand.
No mobile, on-the-floor view for managers
GMs needed a fast, mobile-first way to check orders, throughput, and labor cost without sitting at a desktop.
No accountability across stores
No leaderboard or benchmarking to see which locations were over or underperforming on a given metric.
And underneath all of it, the data itself was scattered. Toast POS, bank statements, and Google Sheets for loyalty and vendor data all needed to feed into one place. Nothing did.
What We Built
A role-based restaurant intelligence platform with four dashboard experiences and an automated data pipeline behind them.
Automated Data Ingestion
A daily, automatic pull from the client's point-of-sale system (Toast), sales, orders, labor, items, and operational metrics, with no manual entry required. A Google Sheets bridge handles the data points the POS doesn't capture, loyalty program numbers, vendor reports, and other manually tracked figures, surfaced directly in the dashboards alongside the POS data.
Role-Based Dashboards: Four Roles, One System
- Leadership Dashboard — a brand-wide view across every location: revenue, average order value, gross margin, prime cost, total orders, store-by-store comparison, week-over-week and month-over-month trends, date filtering, and pacing projections.
- Franchisee Dashboard — the same metrics as Leadership, automatically scoped to just the location or locations that franchisee owns.
- GM Dashboard — a mobile-first view built for on-the-floor use: orders, throughput (orders per labor hour), and labor cost as a percentage of sales.
- Store Leaderboard — every location ranked against the others on a metric the user chooses, so underperforming or standout stores are immediately visible.
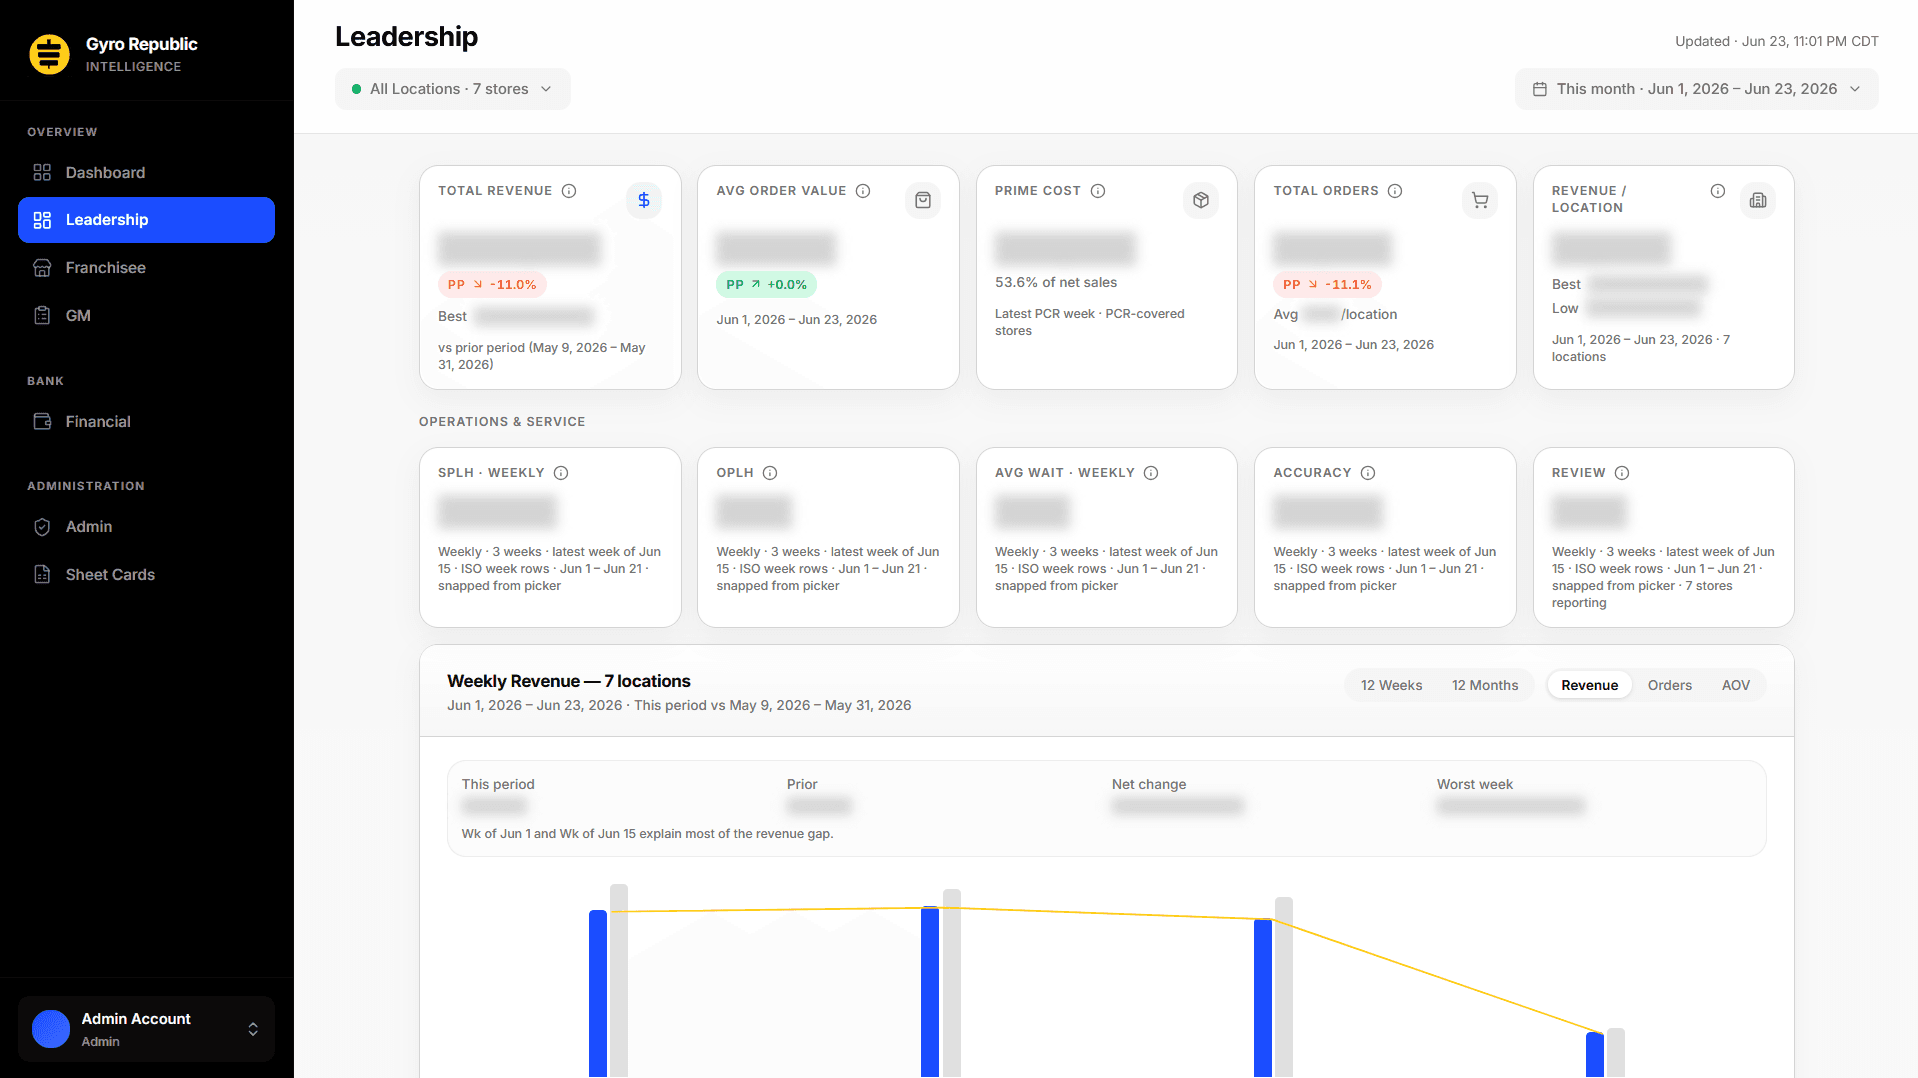
Leadership Dashboard: brand-wide KPIs and weekly revenue trend
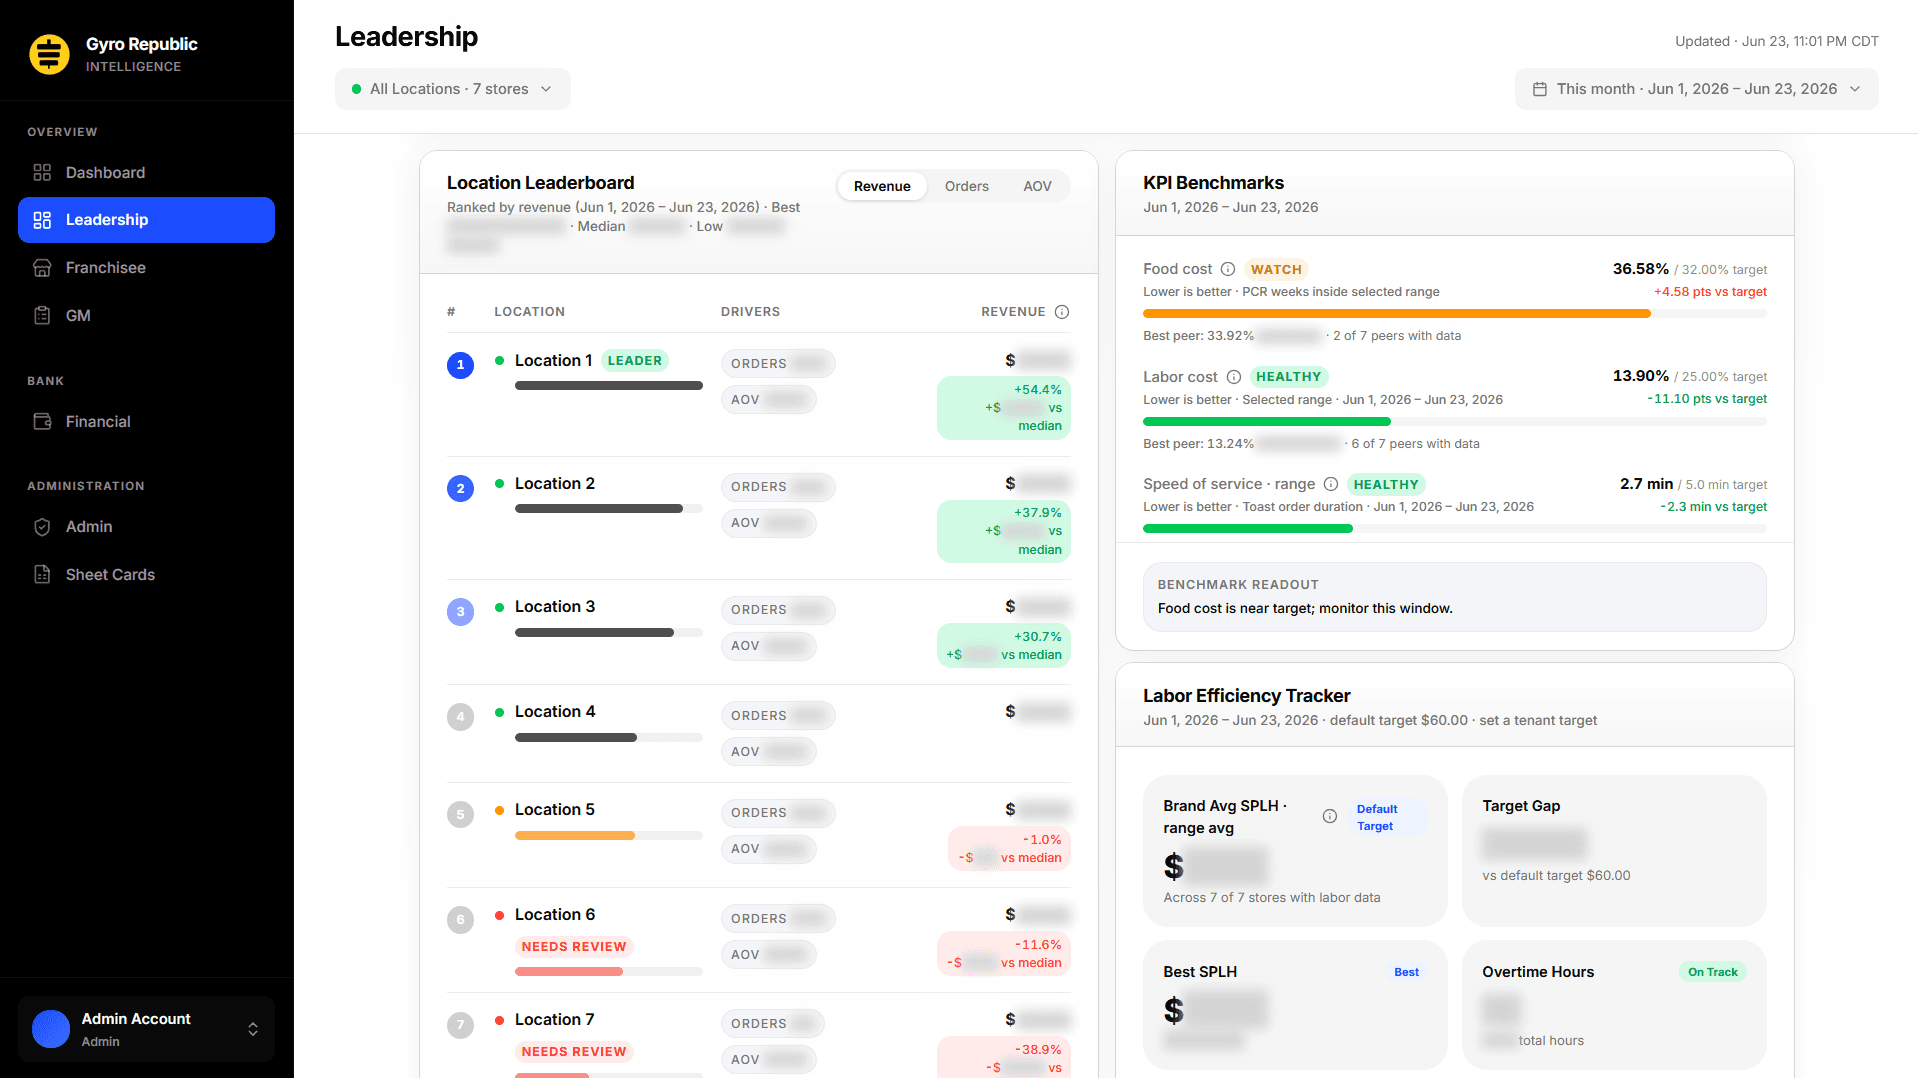
Store Leaderboard and KPI benchmarks, built into the Leadership Dashboard
Financial Intelligence
Upload a CSV bank statement and AI automatically sorts transactions into the client's own expense categories, vendors, payroll, utilities, marketing, and more, with a manual override that teaches the system to get more accurate over time. A dedicated financial view turns that categorized bank data into a P&L-style breakdown, revenue and expenses, with each expense line shown as a percentage of both sales and revenue.
Operational Accountability
- Voids, comps, and refunds tracking.
- Speed-of-service and labor-cost monitoring per store.
- A single configurable alert (e.g. flagging a meaningful revenue drop versus a normal trailing baseline) surfaced directly in-app.
Access & Platform
Google sign-in with four access tiers (Admin, Leadership, Franchisee, GM), each person only ever sees the locations and data appropriate to their role. The platform installs like a native app on phones and tablets (Progressive Web App, add-to-home-screen on iOS and Android), no app store required.
How We Approached It
Met the client's existing tools instead of replacing them.
Rather than asking the client to switch point-of-sale or accounting systems, we built directly on top of what they already used, pulling data automatically from their POS every day and bridging the gaps with a simple Google Sheets connection for anything the POS doesn't track.
Designed around who's looking, not just what's being shown.
Instead of one dashboard everyone has to interpret for themselves, we built four, each tailored to what that person actually needs to act on, from a phone-in-hand store manager to brand leadership comparing locations.
Used AI to remove a manual chore, not as a gimmick.
Categorizing bank transactions by hand is tedious, error-prone busywork. We used AI to do the first pass automatically, with a human-in-the-loop override so the system gets smarter from corrections over time instead of repeating the same mistakes.
Built for how restaurant managers actually work.
The on-the-floor manager view was designed mobile-first, installable on a phone home screen, because that's where the decisions actually get made, not at a back-office desktop.
Secured the data at the foundation, not just the surface.
Because the platform serves multiple locations and ownership tiers under one system, access control was enforced at the database level, not just hidden in the interface, so each role only ever touches the data it's permitted to see.
What This Lets the Client Do Now
- ✓See how the entire brand, and every individual location, is performing in one place, updated automatically every day, without anyone pulling manual reports.
- ✓Compare locations against each other instantly via the leaderboard, surfacing top and bottom performers at a glance.
- ✓Let franchise owners check their own location's numbers without needing to ask headquarters or dig through POS exports.
- ✓Give on-site managers a phone-based view of the metrics that matter for running their shift.
- ✓Turn bank statements into categorized expense reports automatically instead of doing it by hand every period.
- ✓Get an early warning when something significant changes, like a meaningful sales drop, instead of finding out after the fact.
- ✓Operate as one connected system that can scale to more locations without rebuilding anything.
Common Questions, Straight Answers
More from the Lab
How We Cut Cost Per Lead from $16 to $5.43
The creative strategy framework behind it. Same budget, same targeting. Different creative.
Read →--meta-adsMeta Ads Credit Card Deadline: What to Do Before April 1st
How to switch billing, what it means for cash flow, and the exact message to send each type of client.
Read →--lead-genFacebook Lead Forms vs Landing Pages
Which funnel setup actually converts and when to use each.
Read →--ai-toolsClaude vs ChatGPT for Coaches and Consultants
Which AI actually does the work? Architecture, persistence, and compounding compared.
Read →--ai-toolsControl Your Computer From Your Phone Using Claude
Step-by-step Remote Control setup. No coding required. 10 minutes.
Read →--claude-codeClaude Code Slash Commands That Actually Matter
The slash commands that build persistent context instead of disposable chats. /init, /memory, /compact, /plan, and custom skills.
Read →--claude-codeClaude Code Routines: Run Your Work Without Being There
Saved AI sessions that run in Anthropic's cloud on a schedule, webhook, or GitHub event. Four routines that cut the Supervision Tax in half.
Read →--claude-codePut Video on Your Service Page Without a Video Team
Claude Code writes the code, Remotion renders the MP4. Roughly ten minutes from cold machine to a thirty-second branded promo for the page that matters most.
Read →--geminiGemini Multimodal: The AI That Sees Your Work
When to use Gemini instead of Claude or ChatGPT. Video, photos, recordings, and image generation for coaches and consultants.
Read →--email-deliverabilityGet Out of Spam — Or Keep Losing Revenue in Silence
Why your emails land in spam and the infrastructure framework for fixing it.
Read →--ai-videoAI Motion Control: Cinematic Video with Higgsfield
Create cinematic AI video using Higgsfield. No camera crew, no budget.
Read →--meta-adsHiggsfield MCP: Four-Variant Ad Pipeline From One Prompt
Install Higgsfield as a Claude Code connector. One prompt produces four awareness-stage video ads, Reels-vertical, ready for Meta Ads Manager upload.
Read →--meta-adsRun Meta Ads from Claude (Official MCP Guide)
Install Meta's official MCP for Claude Desktop, Claude.ai, or ChatGPT, or the Meta Ads CLI for Claude Code. Free during open beta, no developer app required.
Read →--meta-adsClaude Cowork for Creative Strategists
Three saved Cowork prompts that compress Meta-ads research: Ad Library teardowns, multi-brand monitoring, and review-to-persona research feeding the next brief.
Read →--free-toolClean Copy — Make AI Text Sound Human
Free browser tool that strips AI tells from your copy. Paste, pick a mode, get human output.
Try it →--free-courseLearn Claude Code — Free 5-Lesson Video Course
Set up VS Code with Claude Code, build a landing page, and deploy live with Vercel. Five lessons, no coding experience required.
Watch free →--ai-toolsSix Steps to a Claude That Actually Works for Your Business
Set up Claude with memory, projects, and custom writing styles so it works like a trained team member. Six setup steps that compound.
Read →--ai-toolsHow to Switch from ChatGPT to Claude (And Why It Matters for Your Business)
Where Claude outperforms ChatGPT for business work, and how to bring your ChatGPT context into Claude in about twenty minutes.
Read →--ai-toolsClaude Cowork: Stop Asking. Start Delegating.
Getting started with Claude Cowork. Covers Global Instructions, autonomous tasks, and saved Skills. For business owners who want to delegate, not just chat.
Read →Want Something Like This for Your Business?
We build the full system, the data pipeline, the role-based dashboards, the AI layer, for one client per quarter.
// One client per quarter
Book a CallNo commitment. No pitch deck. Just a straight conversation about what's possible.